.png?width=500&height=91&name=CG-Logo-Blue%20(1).png)
The Dashboards feature of the Data Intelligence module enables you to gain a comprehensive understanding of how your platform is being used over time.
Note: Data Intelligence is an add-on module. Contact your Client Success Manager to learn more. Once enabled, access will require the Dashboards & Insights admin permission.
These dashboards help platform admins visualize engagement metrics and platform adoption. In addition to data visualization for our core platform features: Events, Groups, Community, Communication, and Revenue, you will also gain insight into general usage, such as active users, new users, and users by device.
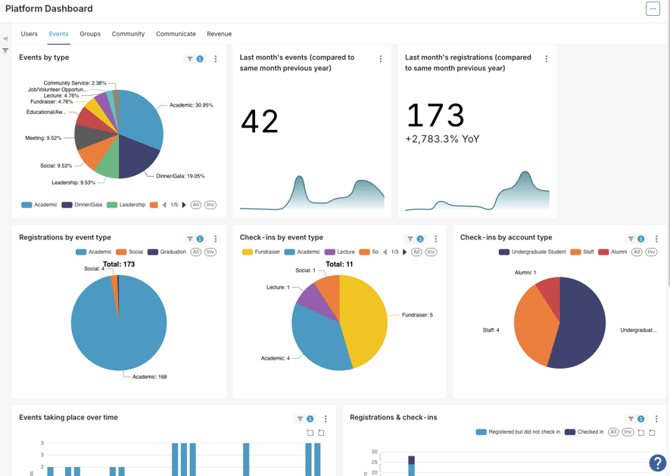
Note: If your dashboards are not displaying as expected, see our Troubleshooting tips.
Access
The dashboards are available from the Data section, in the top menu. Once you add the Data Intelligence module to your contract and the feature is enabled in your tenant, these features will be unlocked and accessible by Admins.
Permissions
Once Ready Education has enabled the “Dashboards & Insights” feature in your tenant, any Admin with the “Is Admin” permission can access the Dashboards from the Admin menu. If certain Admins should not have access to view platform-wide analytics, an Admin with the ability to “Set Permissions” can go to ADMIN > Users > Administrators to revoke the “Dashboards & Insights” permission for those specific users.
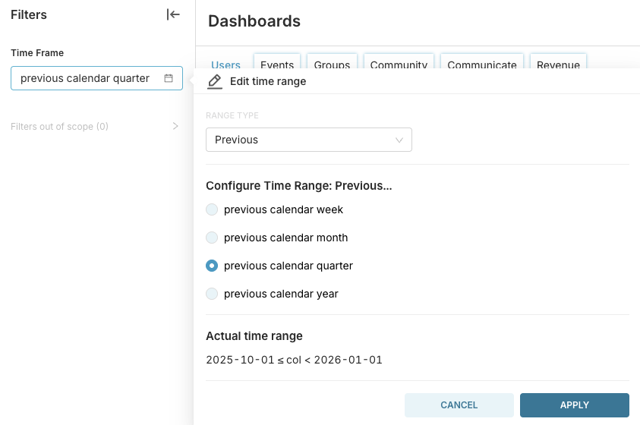
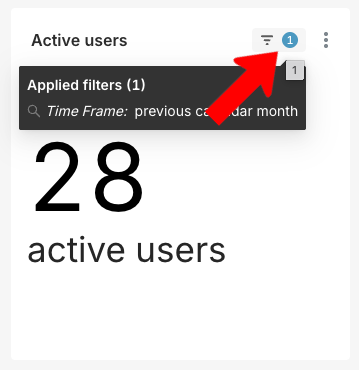
The default time period for each dashboard is the previous calendar month. You can change this by clicking the filter icon.
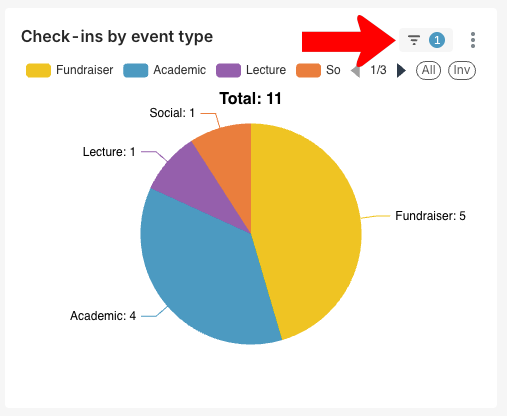
Set a different time range and click Apply.
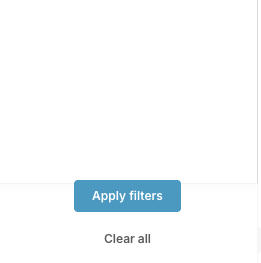
Then click Apply filters.
Understanding Charts & Data
Use the top three-dot menu to view the chart description, which provides details about the specific query, as well as questions the chart is designed to answer. View the chart in full-screen for better legibility of the data and the description.
You can also “Drill to Detail” to view the source data. This is not intended as a way to export the raw dataset, but as a way to gain a clearer understanding of the type of fields being referenced to render the chart. Report Builder is a better solution for exporting records as .csv files.
Each dashboard has a More (three-dot) icon, which opens a menu with several options.
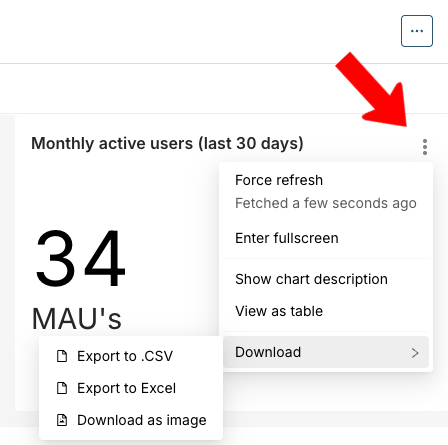
- Force Refresh: Present the most recent data
- Enter fullscreen: View the chart in a larger size for clarity
- Show chart description: Details about the specific data query
- View as table: Switch from visual to table data format
- Download: Export the data in a variety of spreadsheet or graphic formats
Note: The More icon at the top of the Platform Dashboard page enables you to download multiple dashboards.
Dashboard Troubleshooting
You see Data error: 400 Bad Request.
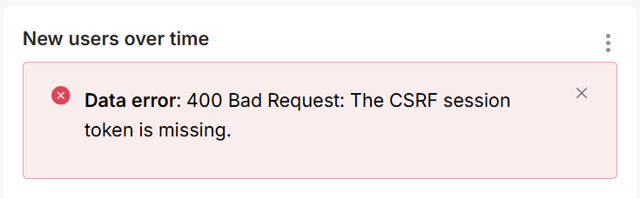
There are three possible reasons for this error:
- You have left the page dormant for over two hours, after which the token expires. Simply reload the page.
- You are attempting to view the dashboard in a private browser or incognito mode. (Private browsers do not support the use of passing a guest token, which is how the authentication works when loading the analytics interface within CampusGroups). Try loading the dashboard in a non-private browser
- You are viewing the dashboard in a browser whose settings prohibits the method used to authenticate you to view your data.
- In Safari, go to Safari > Settings/Preferences > Privacy, and uncheck Prevent cross-site tracking.
- In Edge, go to Edge > Settings > Privacy, search, and services > Tracking prevention. Switch from Balanced (the default) to Basic. You may also need to go to Settings > Cookies and site permissions > Manage and delete cookies to toggle off Block third-party cookies.
- In Chrome, go to Chrome > Settings > Privacy & Security > Third-Party Cookies and uncheck Block all third party cookies.
You are not seeing all available data.
If you are seeing empty charts, it’s possible that your tenant has not yet been added to our data pipeline. All new production tenants should automatically be added, but this may take up to two weeks.
If you are seeing data that seems misaligned with data from other areas of the platform, view the chart description to ensure you understand the data presented. You can also check whether the dashboard has a filter applied. A filtered chart will have a number next to the filter icon; hover over this number for details, and remove filters if needed.
If you still feel that the chart misrepresents your data, submit a support ticket.